The reason a graph without zero can double an effect
Truncating the y-axis does not change the data. It changes the slope the eye sees, and the eye reads slope as magnitude before the mind reads the numbers.
Intuition test — answer before you read on
Revenue bars look flat from zero but dramatic from 96. The data is identical. What changed?
A bar chart shows quarterly revenue: 98, 100, 102, 104 million. When the y-axis starts at zero the bars look nearly identical. When the axis starts at 96 the bars show a dramatic staircase. The data has not changed; the visual encoding has, and the visual encoding is what the viewer processes first and remembers longest.
What everyone sees
The truncated axis looks like a reasonable design choice: starting at 96 uses the space efficiently and shows the trend more clearly. The viewer may not notice the truncation at all, because the axis label is small and the visual pattern is loud. Even viewers who notice the starting point rarely recalculate the slope in their heads, because the visual impression has already formed.
What is actually happening
Pandey and colleagues experimentally confirmed that truncated axes cause viewers to overestimate the magnitude of differences, even when axis labels are clearly visible. Cleveland and McGill’s foundational work on graphical perception showed that humans decode differences in bar height as ratios, not as absolute lengths. When the baseline is moved from zero to 96, the visible height difference between 98 and 104 is tripled, and the perceived effect size scales with the visible ratio rather than the actual ratio.
Why it stays hidden
The distortion hides because the numbers on the axis are accurate and the data points are correctly plotted. No data has been fabricated, so the graph passes every fact check. The deception lies in the encoding, not the data, and most media-literacy training focuses on the data rather than the encoding. A viewer trained to check whether the numbers are correct will find that they are, and conclude that the graph is honest.
A graph with correct data and a truncated axis is not lying about the numbers. It is lying about the shape.
A graph with correct data and a truncated axis is not lying about the numbers. It is lying about the shape.
Collect this card
A graph with correct data and a truncated axis is not lying about the numbers. It is lying about the shape.
0 / 10,000 collected
Sources & further reading 2
- Pandey et al. — how deceptive are deceptive visualizations?
- Cleveland & McGill — graphical perception: theory, experimentation, and application
Cross-references
Related files
-
No visual on fileScarcity & Queues Entry #0460
The reason rationing changes what people want
A product that was adequate becomes desirable when restricted. The restriction changed the inference the buyer draws, not the product itself.
MasterThe hidden part #0460A quota does not just limit access. It changes the inference about what is being accessed. The product behind the restriction is perceived as the product that deserved the restriction.
Scarcity Open file -
No visual on filePrice Psychology Entry #0360
The reason a currency without symbols raises spend
Remove the dollar sign and the number stops feeling like money. It becomes a score, and scores are spent differently from budgets.
MasterThe hidden part #0360A currency symbol is not information. It is a pain cue. Remove it and the number stays; the flinch goes.
Pricing Open file -
 Hidden Numbers Entry #0004
Benford’s Law: why 1 leads the ledger
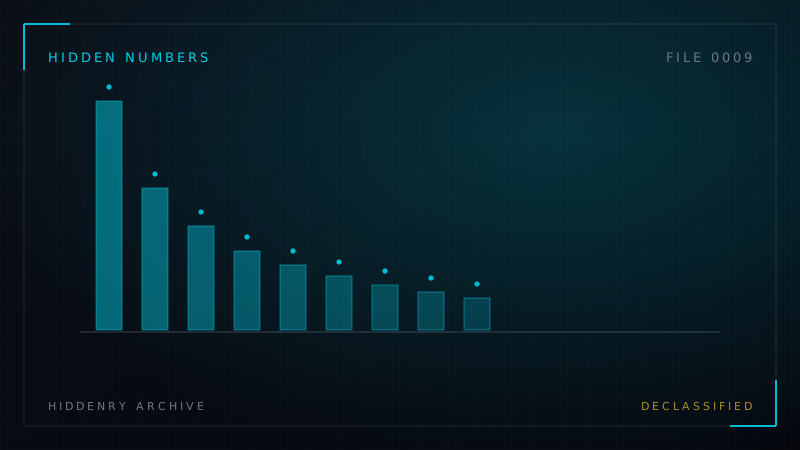
In real-world data, about 30% of numbers start with the digit 1 and only 4.6% start with 9. Fraud investigators use that gap as a lie detector.
MasterThe hidden part #0004Genuine numbers are unevenly distributed. Invented numbers are suspiciously even.
Numbers Open file -
No visual on fileScarcity & Queues Entry #0455
Why one-per-customer raises the average purchase
A limit of two per customer raises the average quantity bought. The restriction is read as information about how many one ought to take.
MasterThe hidden part #0455A limit is not only a ceiling. It is a suggestion, and it usually sits above what the buyer had in mind.
Scarcity Open file
Annotations are reserved for archive members.
Sign in to annotate