The reason a self-selected panel overstates strong opinions
Answering costs time, and the people who pay it are those with something to say. Indifference is the hardest state to get into a dataset.
Intuition test — answer before you read on
Why does a low-response survey overstate polarisation?
Eleven per cent respond. Of those, a third are furious, a third are enthusiastic, and the report describes a divided workforce. The seventy-nine per cent who did not reply were mostly people for whom the topic did not rise to the level of an opinion.
What everyone sees
A low response rate is understood as reduced precision — a smaller sample with wider intervals, correctable by weighting to known demographics. Weighting addresses composition, not intensity. Whether someone bothers to answer is correlated with how strongly they feel, and no demographic variable in the file carries that information.
What is actually happening
Rogelberg and Stanton set out the structure of organisational survey nonresponse, distinguishing passive non-response from active refusal and showing that respondents and non-respondents differ on attitudinal variables in ways that demographic weighting cannot repair, because the propensity to answer is itself an attitude. Keeter and colleagues compared a standard survey with a much more intensive effort achieving far higher response and found that many estimates were similar, while a subset — particularly measures of civic engagement and issue intensity — differed systematically. The nuance matters for honesty: low response does not corrupt everything, but it reliably overstates whichever variables correlate with the willingness to answer, and intensity of opinion is the clearest of those.
Why it stays hidden
The distortion hides because the report reads as a distribution. Percentages sum to a hundred, subgroups are compared, and the indifferent majority appears nowhere — not as a category, not as a caveat. Findings are then acted on as if the workforce were divided, which produces communications aimed at a conflict most people were not in.
Willingness to answer is itself an attitude, and weighting cannot repair it. Indifference is the state a voluntary survey cannot record.
Willingness to answer is itself an attitude, and weighting cannot repair it. Indifference is the state a voluntary survey cannot record.
Collect this card
Willingness to answer is itself an attitude, and weighting cannot repair it. Indifference is the state a voluntary survey cannot record.
0 / 10,000 collected
Sources & further reading 2
- Rogelberg & Stanton — understanding and dealing with organizational survey nonresponse
- Keeter, Kennedy, Dimock, Best & Craighill — gauging the impact of growing nonresponse on estimates from a national survey
Cross-references
Related files
-
No visual on fileStatistical Illusions Entry #0435
The reason a graph without zero can double an effect
Truncating the y-axis does not change the data. It changes the slope the eye sees, and the eye reads slope as magnitude before the mind reads the numbers.
MasterThe hidden part #0435A graph with correct data and a truncated axis is not lying about the numbers. It is lying about the shape.
Statistics Open file -
No visual on fileScarcity & Queues Entry #0460
The reason rationing changes what people want
A product that was adequate becomes desirable when restricted. The restriction changed the inference the buyer draws, not the product itself.
MasterThe hidden part #0460A quota does not just limit access. It changes the inference about what is being accessed. The product behind the restriction is perceived as the product that deserved the restriction.
Scarcity Open file -
No visual on filePrice Psychology Entry #0360
The reason a currency without symbols raises spend
Remove the dollar sign and the number stops feeling like money. It becomes a score, and scores are spent differently from budgets.
MasterThe hidden part #0360A currency symbol is not information. It is a pain cue. Remove it and the number stays; the flinch goes.
Pricing Open file -
 Hidden Numbers Entry #0004
Benford’s Law: why 1 leads the ledger
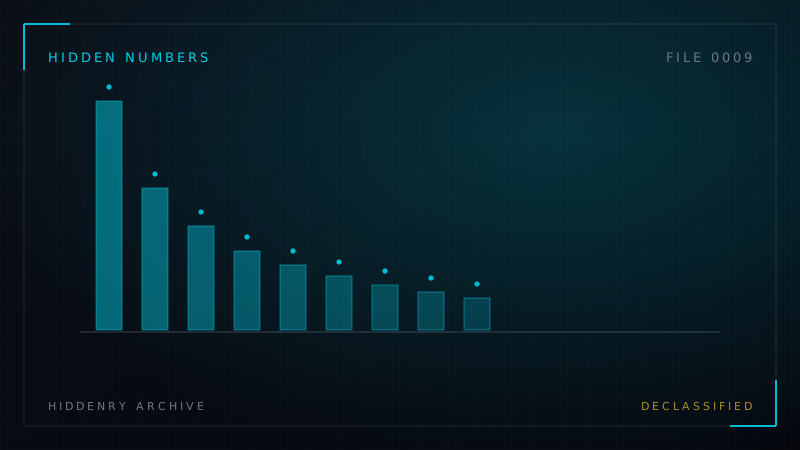
In real-world data, about 30% of numbers start with the digit 1 and only 4.6% start with 9. Fraud investigators use that gap as a lie detector.
MasterThe hidden part #0004Genuine numbers are unevenly distributed. Invented numbers are suspiciously even.
Numbers Open file
Annotations are reserved for archive members.
Sign in to annotate