Why the best performers regress next season
Extreme results are part skill and part luck. The luck does not repeat, so the best performers drift back without anything having gone wrong.
Intuition test — answer before you read on
A programme is given to the worst-performing units and their scores improve. What does this establish?
The top ten of any season underperform their own record the following year with striking reliability. So do the bottom ten, in the opposite direction. Managers, journalists and the performers themselves reach for explanations — complacency, pressure, a changed routine — for a pattern that requires none of them.
What everyone sees
A decline after a peak invites a cause. Something must have gone wrong: the award created pressure, the contract removed hunger, the method stopped working. The narrative satisfies because the fall is real, visible, and attached to identifiable people who can be asked about it.
What is actually happening
Any measured outcome mixes a stable component with a variable one. Selecting the extreme selects cases where the variable part happened to be large and favourable, and the variable part does not repeat. Galton described the effect in human height in the 1880s, and it appears wherever selection is made on a noisy measure: league tables, school rankings, and any programme that recruits its worst cases.
Why it stays hidden
It hides because it predicts exactly what a successful intervention would predict. Treat the worst-performing units and they improve; punish the best and they decline; in both cases the numbers move as the story says they should. Without a control group drawn from the same extreme, regression and effectiveness are indistinguishable, which is why the effect keeps being reported as a finding.
When a measurement is partly noise, the top of the table is where the noise was largest.
When a measurement is partly noise, the top of the table is where the noise was largest.
Collect this card
When a measurement is partly noise, the top of the table is where the noise was largest.
0 / 10,000 collected
Sources & further reading 3
- Galton, "Regression Towards Mediocrity in Hereditary Stature", Journal of the Anthropological Institute, 1886
- Barnett, van der Pols & Dobson, "Regression to the Mean: What It Is and How to Deal with It", International Journal of Epidemiology, 2005
- Kahneman, "Thinking, Fast and Slow", 2011, chapter on regression to the mean
Cross-references
Related files
-
No visual on fileStatistical Illusions Entry #0435
The reason a graph without zero can double an effect
Truncating the y-axis does not change the data. It changes the slope the eye sees, and the eye reads slope as magnitude before the mind reads the numbers.
MasterThe hidden part #0435A graph with correct data and a truncated axis is not lying about the numbers. It is lying about the shape.
Statistics Open file -
No visual on fileScarcity & Queues Entry #0460
The reason rationing changes what people want
A product that was adequate becomes desirable when restricted. The restriction changed the inference the buyer draws, not the product itself.
MasterThe hidden part #0460A quota does not just limit access. It changes the inference about what is being accessed. The product behind the restriction is perceived as the product that deserved the restriction.
Scarcity Open file -
No visual on filePrice Psychology Entry #0360
The reason a currency without symbols raises spend
Remove the dollar sign and the number stops feeling like money. It becomes a score, and scores are spent differently from budgets.
MasterThe hidden part #0360A currency symbol is not information. It is a pain cue. Remove it and the number stays; the flinch goes.
Pricing Open file -
 Hidden Numbers Entry #0004
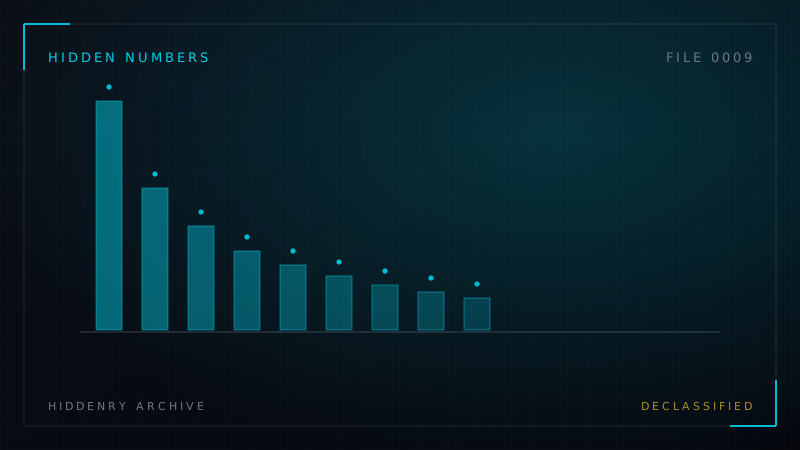
Benford’s Law: why 1 leads the ledger
In real-world data, about 30% of numbers start with the digit 1 and only 4.6% start with 9. Fraud investigators use that gap as a lie detector.
MasterThe hidden part #0004Genuine numbers are unevenly distributed. Invented numbers are suspiciously even.
Numbers Open file
Annotations are reserved for archive members.
Sign in to annotate